May 2009
Monthly Archive
2009-05-31
This morning, the ordinarily coherent and insightful Barry Ritholtz featured a letter from $GM supplier Gregory Knox in reply to the $GM mother ship’s request for “support” and “urgent action” on $GM’s behalf from its fiefdom. What they got back from Mr. Knox was urgent, but hardly supportive: a double-barrel castor-oil rant, scattered as can be and just as self-righteous as the first, against the “entitlement mentality”, the “world’s most overpaid, arrogant, ignorant, and laziest entitlement-minded ‘laborers'” and their “atrocities”, against “our new ‘messiah’, Pres-elect Obama”, against “the rest of the world” and their anti-capitalist bias, and pretty much everything in between.
Mr. Knox asserts that $GM has made its own grave, and I have seen nothing in my decades in this country to doubt that. It’s pretty obvious, and has been for a long while, that it’s a company that executes poorly at many levels, outgamed from time immemorial by its more business-savvy competition. As for its most imminent demise, there is somewhere a Madoff parallel to draw: only when the inflows slowed down did the veil come off the failure entirely.
The problem with Knox’s letter is equally grave, however, founded as it is on absolute certainty–his own–about a point of view he cannot articulate coherently–also his. Rather than convince anyone of anything, he spews an illogical and ill-reasoned set of misaligned beliefs that must add up to an argument because, well, he says they do. His sanctimonious tone (“Don’t even think about telling me I’m wrong. Don’t accuse me of not knowing of what I speak.”) cannot hide the fact that he cannot argue, because he cannot make a case. His writing cannot be wrong, because it demonstrates an incapacity to understand what it would take to be right. He hardly knows what he’s talking about, because he’s not talking about anything. Which is precisely why he asks his reader not to accuse him of not knowing what he’s talking about.
I do not dispute for a moment that laziness, sloth, and greed have run rampant in American industry and the American dream, but the deeper problem is that we’re a bunch of undereducated jackasses, and now that the inflow has slowed, we can’t hide it any more. Global Dominance and the Power of Success have kept us safe in our beliefs, and those beliefs are now failing right alongside the dominance and the success, just as we try to fall back on them as salve to the wounds we inflicted on ourselves by believing in our beliefs instead of fucking learning something.
So Mr. Knox jumps up and down on paper, rolls up Detroit, $GM, the Obama Jesus (who, apparently, was elected to perpetuate sloth’s atrocities), the bank bailout, productivity, free-market capitalism, parenting, and failed parenting in one happy glob of amalgamated rhetorical gibberish–please do read the whole thing, as an outstanding Goofus to useful writing’s Gallant–and closes by saying
Sorry – don’t cut my head off, I’m just the messenger sharing with you the “bad news”. I hope you take it to heart.
Oh, Mr. Knox, I have taken that bad news to heart. But you are mistaken: You are no mere messenger, unless that letter wrote itself. Because it is bad, bad news. $GM will be sold off for parts and change, while you will go on believing yourself to be the angel Gabriel a-trumpeting bedrock truth from on high, despite the fact that you offer us twelve hundred words of goop. No thinking, no clarity, no insight, just a bunch of words shuffled together from the loudmouth deck of punditry that now passes for thinking in this country, turning it up to 11 day after day. Cable news will be in touch.
We have a deep thinking problem, in both senses, far deeper than our economic woes. Sure, the economy collapsed, but as we seek to rebuild we are being outthought, and firing off idiotic rants all the while. We cannot take responsibility for it, because we cannot see it, because we cannot think outside our own beliefs. The first responsibility of an education is to understand the value of replacing belief with knowledge, prejudice with appreciation of complexity.
Business is neither an intellectual nor a rhetorical pursuit, of course. But we are not going to hack our way out of this crisis with a bunch of pieces of our minds. Especially angry, clumsy, lumpy, dribbling bits like this one, still circulating at least 6 months after it should have yellowed and flaked away in Gregory Knox’s outbox.
2009-05-28
Few words tonight. I would call your attention to the fact that everyone is talking treasury yield danger, a story barely in existence last week. (Into which I read, old bad news is no longer bad, but new bad news?) And that we have now put in three lower highs, without breaking that 875ish level on the $SPY. It will loom larger and larger.
Without further ado:
- Market Talk (summary, no charts)
- Jack McHugh (summary with links)
- Cobra’s Market View (chart analysis, liking this cat’s style)
- The Chart Pattern Trader (video chart analysis, ~30 mins but gets a little macro tonight – skip ahead to ~10:30 if you just want charts. Really is for today, even though it says 5-19 on the video caption.)
That’s it as of the wee wee hours. I remain mouthy intraday on twitter if you care to mouth along.
Be careful out there.
2009-05-25
This weekend I looked at daily charts for every ticker in the S&P 500. A sort of eyes-on stock screening, if you will. I was looking for good short setups, and there are many, but this post will focus on one type of setup only: the simple and recent break of a ticker’s rally trendline.
I’m not expecting fireworks and meltdowns this week, but rather further development of the destabilizing and weakness we’ve seen over the last 2 weeks. Bullishness abounds still, and plenty of participants (or would-be participants) are still willing to get in on the upward action, even if it appears to have stalled for the moment. I still expect dips to be bought, and “consolidation” and “profit-taking” to be the bromides applied to any further downside movement in the immediate future.
Everything I say here could of course be absolutely wrong, but after watching closely and trading very lightly over the last few weeks, I am convinced that weakness is coming in. The $SPY chart (see yesterday’s post if you need one to look at) would appear to have put in a lower high this week, and dip-buying has now met its match in rip-selling. The program traders are dumping lots as they did not in March or April, even (scheduling via automation, I assume, as they had undoubtedly all headed out to the Hamptons or Mallorca for the long weekend) on a low-volume day like Friday.
But generally, I expect weakness to creep along, and for it to appear one stock at a time until the chasers are suitably chastened. Hence the value in stockpicking here, on both the short and long sides.
The setup I was looking for needed some steep and consistent rallying off March lows, and a very recent break of the ticker’s rally trendline, so that it’s in backtest/lower high mode. I will be looking to short these stocks if and only if they reconfirm a fail of the backtest. If they break convincingly back into their rally channel, I get stopped out. If they break down tomorrow and kiss the channel goodbye for good, I will consider them missed opportunities, and will not chase.
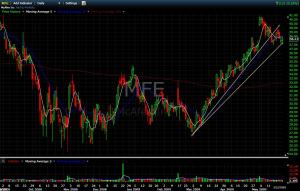 An example of an earlier so confirmed version of the movement I’m describing (and still a good short I think, but that’s another story) can be seen in this $MFE chart. Note the colossal rippage over the last couple months, the weakening off the May 4 high, leading to the May 13 break of the trendline. (This is where the names I have chosen would now stand.) Three days of retesting that trendline and failing to break above it results in a new lower high on May 19 (the day I would have looked to short), and then a nice breakdown. Assuming a reasonable entry of just over 39, you would now be up about 0.80, or just over 2%, with some further weakness looking quite technically likely: a 5-day SMA below the 20-day and flat, fanning trendlines, etc. etc.
Before looking at the other names, a couple of notes: one, I am not a chartist, nor would I trade any more without charts. You may find some of my trendline drawing a little odd; I believe charts are messy and full of the error common to most endeavors of human folly, cataloguing the market version of which is this blog’s reason for being. So I draw them where they make sense to me; you should not take them as technical guidelines, “training”, or anything else.
Similarly, I will describe some possible setups here, but following them blindly would be very silly on your part. You are not in my head, you do not read charts or broader movements as I do, and of course you do not trade what I trade. I’m describing one way of seeing these charts. I do not even say these are trades I will take myself; I’m just interested in what looks like some very good low-risk/solid-return setups. My goal is to improve my perception; I hope you have a similar goal. Otherwise, you risk frustration should a trade backfire for reasons you have not anticipated.
And finally, these are not home-run shorts I’m looking for. Too much uncertainty, too much influence from the news and the spin, and too many jumpy buyers just make shorting and holding for indefinite targets seem too risky to me. Small gains on low risk and relatively short holding periods (under 8 days) is my current strategy.
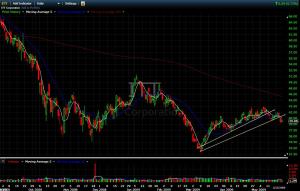 $ITT is, according to CAPS, “A multi-industry company engaged directly and through its subsidiaries in the design and manufacture of a range of engineered products and the provision of related services.” It did not actually rally as hard as my other picks, and it is headed into a zone of late-2008 congestion, but I like its lower high pre-break after reconfirming its 2009 earnings outlook, and would be surprised to see it clear that high again.
Entry on failed retest of trendline (~41.20) or, shorter-term/higher risk, failure to move above 5-day SMA (~40.50) T1 38.00 T2 37.00 T3 …
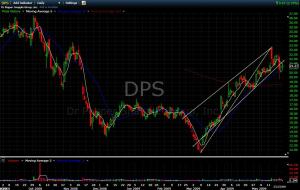 Ah, $DPS. Who doesn’t need a nice refreshing beverage in the summer? Me. And, it would appear, what is left of the rally. Steep rise here, clean break and lower high. Though you could also make the case, I suppose, that it failed its breakout (note the strangeness of my trendline) and is merely falling back into an April consolidation zone. (If you’re like me, you don’t really believe anything consolidated in April, being as it was so much ether and shortness of breath, but I digress.) I like the weak-volume failed breakout and the higher selling volume, I like the sharp moves down off the recent highs as reflected in 5-day SMA action, I just plain like it.
Entry on failed retest around 22. T1 20-20.25 T2 200-day SMA T3 ~18.70 T4 17.30ish
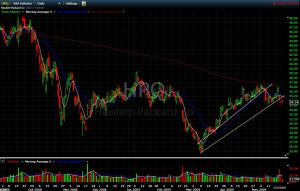 $HPQ is to me the trickiest of the four, mainly because the Q’s look much less decisively weak than the S&P (after earlier weakening). I see all kinds of great technical reasons here–it has now broken two trendlines, has a nice double-top/failure at 200-day, down in the lower end of its congestion zone–and last week’s earnings and guidance were pretty grim–but if the Q’s caught fire I would dump this quickly. It’s that “name you can trust” problem. Investors love it when you lay off a bunch of people!
Entry around where trendline and 5-day meet, ~35 (as always, after a high is in, not on the way up). T1 33.50 T2 32.80 T3 30.00
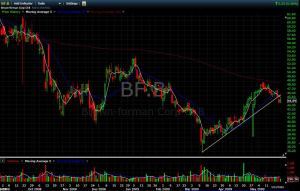 Booze is a cliche rally favorite, and $BF.B (or $BF-B or $BF/B or whatever depending on your broker) is looking mighty tired. I find this the prettiest chart–note the blow-off top, the slow decline into longer-term trend break, the angle of the 5-day (under the 20-day, under the 200) , etc. etc. Link
But it also has the trickiest entry, as it has yet to put in a lower high over multiple days, and looks to be in a downward channel already. You might enter anywhere between Friday’s close and 46 or so. Careful! T1 ~44.40 T2 43.40 T3 …
Should I enter or exit these positions, it will be noted, approximately in real time, on twitter. I still anticipate very light trading on my part, so we shall see.
All charts marked up on FreeStockCharts. If you need a free charting resource, get over there and get plotting.
Good luck out there.
2009-05-24
This post is perhaps a little outdated, but I write here to figure things out for myself, rather than to impress you, fictitious reader (FR) with my brilliance, and this is an unclosed loop that began with a post 10 days back, so now I’m gonna close it. First, a couple charts, courtesy of the fine folks at FreeStockCharts (and some very old-skool manipulation on Mr. U’s part, ah well…)
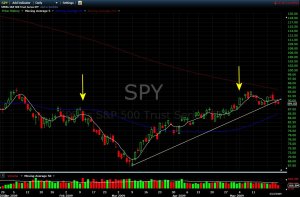 This is a daily chart of the good ol’ $SPY for 2009. Hopefully it looks familiar enough to anyone reading this (and if you’re trading without charts, uh, why?), showing the infamous V. I add a single trendline to show you just how momentous this week’s action may have been to coming weeks’ action. A broken intermediate-term trendline, with a backtest point at a flat 5-day moving average, does not look easy for bulls.
As you can perhaps guess from the two arrows, I’m interested in a couple particular moments as they relate to government and its ability to create and destroy tape. The dates are February 10–the day Geithner gave his first stress test speech–and May 4, the date the stress test “results” were released.
Now, you may or may not remember the action immediately preceding February 10 (arrow #1), and what happened on that day. I remember it quite vividly, because February 5, 6, and 9 saw some real buying strength. On diminishing volume, granted, but I could “feel” the market wanting to rally. (And set myself up, painfully enough, accordingly, but that’s another story.) And then, on February 10, after some light morning selling, Geithner stepped up to the mic at 11 a.m., and literally as he opened his mouth, the market started to drop. Hard. And didn’t quit for another month, is the short version of the story.
Then, over the weekend of March 7-8, Citibank said they’d had a couple of good months, the market was even more deeply oversold, and we were off to the races, punctuated by a series of very cheery announcements from the financial industry, the second-derivative news, and the stress test progress, particularly some leaks (strategic or otherwise) in the final few days before May 4 (arrow #2), when the results were originally meant to appear, or May 7, when the results actually did come out. That week began with a fresh breakout, and ended with the rally high thus far, all, I would venture to say, stress-test related.
You can probably see where I’m going with this: I would venture to say that, in some form, the very same stress tests “caused” a fat drop and an equally sharp rip right back up. The government position, if you followed along, didn’t really change: They said the tests would be relatively low-stress, meant to reassure above all, and the results were apparently ugly but not too ugly, but regardless and in the meantime the market kep about what they meant. Somehow, against this policy, the market managed to convince itself 1) that banks would be nationalized when they failed their tests (with plenty of punditology backing them up in the 24/7 squawk boxes, and the government promising it wouldn’t happen) and 2) that the stress tests were a government sham, and a way of avoiding nationalization. What I find fascinating is that policy got blamed for two contradictory versions of the story, while the market merely mean-reverted, basically ignoring version #2. To clarify: if the banks were to be nationalized, a plummet in share value makes sense, as shareholders feared being wiped out. But if the stress tests were too weak, and th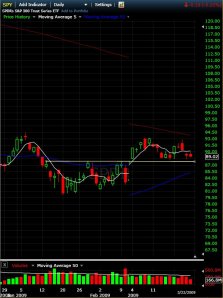 e government was wallpapering over deep cracks in the system, the market should have dropped farther. In terms of sticking to message, the government has been far less schizophrenic than the market.
But I really wrote this to commit a TA cardinal sin, and offer you this second chart. It’s just like the first, but a stress-free edition–it jumps from Feb 10 to May 4. Strap on your tin-foil beanies, and note just how smoothly February 9 would lead us into May 4-8. If you omit the we-hate-Geithner’s-beady-eyed-voice day, you could draw a damn trendline right up it. And why is everyone now watching 875 so carefully? Government be damned: Eliminate the market schizophrenia of February, March, and April, and you have a range-bound market oscillating around it. (As an aside, I cannot imagine a clearer picture of just how important current support is than what this chart shows. Too bad it’s fabricated!)
I have one more trick up my sleeve. If you follow me on twitter–and, y’know, why wouldn’t you? I do–you have heard me grumble and moan over the lack of consolidation all the way up this “rally”, and the ripping behavior and leadership the financials have shown throughout. If I had no more than one sentence to deflate the rally excitement, that would be it: the financials are still dragging the market around by its peroxide-free roots, despite being deeply broken, and demonstrating a most convincing failure of leadership on every economic front possible.
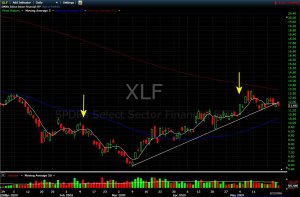 You could perhaps guess what the next trick is. At left, the same 2009 complete daily chart for $XLF. Note a similar break of the simple rally trendline the last couple days. Note the positions of the market at the stress-test inflection points of February 10 and May 4-8.
In keeping with the above summary of rally-hype deflation, I present you with a similarly mangled chart. The trendline has been broken and its backtesting is in line with a break, but note how far above their early-February level the financials still hang. Either February was too low already, or in May we’ve overshot–in other words, the financials market has spent much of this year overreacting to the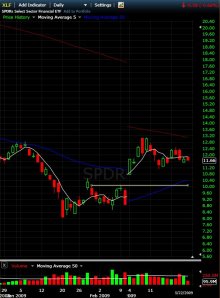 stress tests, in both directions, relative to the S&P. I am not alone in saying we’re overdue for a correction; reasonably, the longer overdue the correction, the more severely participants might react to it, having lost the habit and/or settled into greed; the breaking of the trendline tells me it’s coming, and the big blank space above the February line says it’s got easy room to fall.
Not that this sort of nonsense technical analysis carries any real significance. My broader point is that any reaction to government “intervention” you might read in the tape is disortion, not commentary. We’ve had at least a two-phase reaction to essentially the same government activity. Plenty of other factors have played in the traffic as well, naturally, the most obvious of which is just good ol’ time. I believe Phase 3 is now underway. No doubt traders will yelp about the government having caused it, too.
2009-05-22
Bears had it most of the day, and hard, but those bulls keep thinking they’re gonna get paid off if the turn it. Which, of course, they’ve been right about. Thus far. If you ask me, it is long past time to spank the cocky. (Stop that. You know what I mean.) The $SPY 200 DMA seems to be a universal expectation, which remains to me an outstanding contrarian signal. One way or the other, the burden of proof has shifted back squarely to the bulls.
Without further ado, a buncha recaps:
Careful out there. I’m mostly taking the day off, as approximately 139 shares will trade in “anticipation” of the long weekend.
2009-05-20
Yeah funny day, wasn’t it? Still a-wander and not really play-by-playing–let alone trading this tape, yikes, though I am not all in cash–but it looks awfully messy from here.
There was a lot of noise–in this case, trader noise, not the news variety–yesterday about how so many bears saw TA potential that they were bound to get nailed. And today, everyone going on and on about the $SPY 200 DMA, the bullish consolidation, the blah blah blah.
Here’s the one thing I see: there is an unbroken, one-year-old trendline on the $SPY daily and weekly charts. That trend? Down. Today’s action? This week’s? Last week’s? Last two months’? Uh, crowding, perhaps, but failing, much like September ’08’s action. Failing to go up. Burden of proof, it seems to me, is on the bulls in May. (And no, I’m not talking rhyming cliche.)
Name the better signal, I’m all ears. Otherwise, I’m sticking to my completely untechnical hypothesis: the $SPY 200 DMA will kiss the action before the action kisses it.
Just a couple recaps tonight, and they disagree with each other. Go TA! The silence elsewhere is just as meaningful, I’d say. Without further ado:
Indecision is the watchword. Good luck out there.
2009-05-19
Have been on the road so am not paying the closest attention to the markets at the moment, but today would have been quite a signal even if I’d only stopped in at the close. On pretty measly volume, the recent short-term downtrend on $SPY was broken, and the market had a big up day familiar to anyone who traded from March until early May.
The only observation I would make from checking in and watching the charts throughout the day was that the movement felt a lot more skittish. No more of the surging and steep green candles–much more of a “melt up” effect. Sellers were clearly absent, but buyers were (rightfully, I would say) cautious.
I do not see today as any indication of a new trend, but merely the elimination of the previous short-term trend. Nevertheless, I’m going to be getting a lot more cautious with any short trading in the next couple of days–can’t be a trend until it carries on a couple of days.
Without further ado, your recaps:
- Market Talk (summary, no charts, but a great and concise point of view)
- Trader Mike (chart interpretation by the best)
- Jack McHugh (summary, no charts)
- The Chart Pattern Trader (video chart analysis, very technical, ~29 mins. Tonight’s session includes lots of MACD explanation for new traders.)
Also recommend you take a look at Sentiment Trader’s Tick reading from today.
Good luck out there. Normal posting to resume later this week.
2009-05-13
Dissecting irrationality is a hobby of mine, and the trading community offers fertile material. Take for example the endless trust of the tape’s absolute rightness (yep, a theme here) alongside the endless carping over one government action or another and how it’s destroying the market. The short version of how silly this is goes as follows: if the tape responds only to itself, it doesn’t care what the government is doing. And if government action is driving the tape, well then the tape isn’t a gauge but rather a consequence, and can hold no intrinsic rightness at all.
As a skeptic, I doubt the soundness of the tape–and, by extension, the supposedly free market–at judging anything. I also doubt government’s ability to get things right, but I will take the actions of officials held at least marginally accountable by a marginally vocal and voting populace over the untethered reckless and fraudulent behavior of the free-market bong-hitters who engineered this shitstorm as a decade-long ode to deregulated greed any trading day of the week. (How’d the tape–and so many traders in it–miss that engineering? But I digress.)
The reason the two ideas sit side-by-side in so many minds, of course, has nothing to do with logic, and everything to do with ideology. People who believe one should make more money off the money one has made or inherited (and if someone made money, then it was, quite literally, at someone else’s expense–in this ideology, somebody “worse” at, uh, making money–but I digress) tend to slap at the hands of grabby government, and believe that the market rewards what they already believe–money is an earned reward or a taken punishment, and capital is raised by raising profit, and lowered by failure to grow. Market smart, government dumb, because markets rule, and government just screws them up, is the short version.
But applying that ideology as an explanation of trading-market action is an example of the fallacy known as begging the question (itself an ill-used phrase, but that’s yet another digression). You do not prove that policy adversely affects economy by saying, “The capital markets are being destroyed/propped up by the government!” because if by definition they are free–the 1P here–they can’t be destroyed or made whole by anything but themselves. The basis itself is questioned by the conclusion. (It’s also questioned by the fact that said market is a government construct, but oh well.)
As a skeptic of all kinds of conventional wisdom, I have plenty of opinions about recent government action and market behavior, but they are plenty boring and for the most part irrelevant to this blog. What is key here in my ongoing crusade against the rightness-of-the-tape farce is that the volatility of recent market action–I’m going to be talking about 2009 only here–has sparked endless bitching about how badly the government is handling this crisis, how the Treasury and Fed teams under Bush and now Obama are making things worse than they need to be, etc., etc.
Maybe. But maybe not. The revelations that banks may have been strong-armed into taking capital infusions and the many cozy connections between government money and kingpin banks, to this ideology, and while those two revelations might inspire concern for all sorts of reasons, to tape-believers they are outrageous. It must be tricky to be outraged at both and still maintain a clean ideology (the ideology says the government seeks to thwart the free-marketeers, while in fact these stories add up to a government playing both for and against the market, at the same time!), but they’re really only looking at the stories as counter to their broader belief, which is that government should just step the eff off, except for a little regulation here and there (not by bankers but by… failed bankers? after all, working for the government is working for the enemy), and let that righteous dude The Tape sort it all out.
What a buncha nonsense.
The tape (by implication, in many ways a proxy for the market itself) is just a fluctuating unknown-ratio measurement of past, present, and future. A whole hell of a lot of fluctuation, as any fool watching price action in real time should be able to conclude, is made up of guesswork, of both the consensus and contrarian varieties. It’s an adding-machine tape of perceptions held and strategies employed. A battlefield, sure, and with tactics of equally deep pride and folly, but a bible?
As I’ve said here before, its timeframe has absolutely nothing to do with policy’s timeframe. Take, for example, stimulus spending: how long until its effects kick in in the tape, if they do? Or have they already? When will the market have fully absorbed its primary, secondary, tertiary effects? Good luck herding those cats. But it’s not only the timeframe, it’s the scope of action: investing and trading are about profit fabrication in pursuit of life-liberty-happiness-etc., but government gets to just skip that minty middleman, and go straight to ensuring LLH.
Real-time mass culture foolishly believes that because there is so much real-time judgment flying around, we’re better at making real-time judgments, primary and secondary. (Another question begged.) Real-time ticks have perfected the tape! The proliferation of round-the-clock media and internet prognostication is not proof of its necessity at all, any more than an advertisement is proof of a product’s value. The fact that we won’t shut up with our opinions, and that we are constantly bombarded with the opinions of others, does not mean we are better equipped to gauge the utility of any one opinion. And skilled judgment of one kind doesn’t imply skilled judgment of all kinds; e.g. being a good tape-swami and therefore a good trader–a formidable and uncommon skill–doesn’t mean you know shit about the economy and where it’s going.
If tape players are collectively and in real time passing judgment on this government rather than the relative health of industry, then the tape is even more distorted than it appears on the surface, because we’ll only know how well today’s policy did solving yesterday’s problems after many tomorrows, when the tape will look as (in)coherent and (in)accurate as it always does in hindsight. And in the meantime, new things will happen that will further distort our ability to read today’s tape objectively, and that will make the stimulus spending look like a much better or much worse idea than it “actually” “was”. Not to mention that we’ll never get to go back and redo it all.
This year’s volatile market action has included a violent drop and a violent rip, and throughout it all the chorus of man-the-government-is-doing-this-sooo-wrong has continued more or less unabated. Of course, when the indexes were dropping, that was the government’s fault; why it has climbed so relentlessly is blamed on any number of factors from short-covering to green shoots, but needless to say, credit to the government in equal measure to the scorn heaped on during the drop (and the mid-January to early-May V is quite symmetrical) is nowhere to be heard. Neither market judgment of the economy, needless to say, has been proven to be of value (presumably, the state of things has not so radically altered as to be badly broken and then table-thumpingly sound inside of three months), and with the benefit of sizable retrospect, one or the other side of the V is going to look pretty wrong, whether policy has saved the market, doomed it, or had no effect whatsoever.
The second part of this post will examine this year’s market movement from a fresh and completely unsound chart perspective, looking at the inflection points on Feb 9 & 10 and March 6 & 9 for what they are–moments of herd mentality shifts, trader- not tape-driven, with zero truth in them, and only the most tangential and ideological relationship to government–and at a scenario where the tape would actually have been righter. Start counting the seconds.
2009-05-12
Lots of talks about the dailies in tonight’s recaps, but the hard program selling in the first half of the session was the story today for me, and looked a lot more determined than a 1 (or 2, counting the gap) percent drop in the S&P (and a new lower low) might indicate, before the bulls bought up another dip and got smacked into the close.
Tomorrow should be very interesting indeed. Without further ado:
- Tickerville (video chart analysis, ~18 mins plus 1 min gratuitous U2 finale)
- Chart Pattern Trader (video chart analysis, ~11 mins highly technical, makes the case for a make-or-break manana)
- Market Talk (summary, no charts)
- Jack McHugh (summary, no charts – and I’d follow that Hussman link if I were you)
Be careful out there.
2009-05-10
No time for commentary this evening folks. Without further ado:
Good luck this week.
UPDATE: The unmissable Trader Mike appeared just a few minutes ago.
Next Page »


