This weekend I looked at daily charts for every ticker in the S&P 500. A sort of eyes-on stock screening, if you will. I was looking for good short setups, and there are many, but this post will focus on one type of setup only: the simple and recent break of a ticker’s rally trendline.
I’m not expecting fireworks and meltdowns this week, but rather further development of the destabilizing and weakness we’ve seen over the last 2 weeks. Bullishness abounds still, and plenty of participants (or would-be participants) are still willing to get in on the upward action, even if it appears to have stalled for the moment. I still expect dips to be bought, and “consolidation” and “profit-taking” to be the bromides applied to any further downside movement in the immediate future.
Everything I say here could of course be absolutely wrong, but after watching closely and trading very lightly over the last few weeks, I am convinced that weakness is coming in. The $SPY chart (see yesterday’s post if you need one to look at) would appear to have put in a lower high this week, and dip-buying has now met its match in rip-selling. The program traders are dumping lots as they did not in March or April, even (scheduling via automation, I assume, as they had undoubtedly all headed out to the Hamptons or Mallorca for the long weekend) on a low-volume day like Friday.
But generally, I expect weakness to creep along, and for it to appear one stock at a time until the chasers are suitably chastened. Hence the value in stockpicking here, on both the short and long sides.
The setup I was looking for needed some steep and consistent rallying off March lows, and a very recent break of the ticker’s rally trendline, so that it’s in backtest/lower high mode. I will be looking to short these stocks if and only if they reconfirm a fail of the backtest. If they break convincingly back into their rally channel, I get stopped out. If they break down tomorrow and kiss the channel goodbye for good, I will consider them missed opportunities, and will not chase.
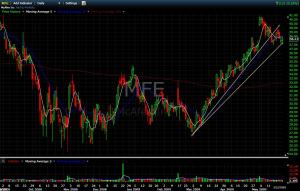 An example of an earlier so confirmed version of the movement I’m describing (and still a good short I think, but that’s another story) can be seen in this $MFE chart. Note the colossal rippage over the last couple months, the weakening off the May 4 high, leading to the May 13 break of the trendline. (This is where the names I have chosen would now stand.) Three days of retesting that trendline and failing to break above it results in a new lower high on May 19 (the day I would have looked to short), and then a nice breakdown. Assuming a reasonable entry of just over 39, you would now be up about 0.80, or just over 2%, with some further weakness looking quite technically likely: a 5-day SMA below the 20-day and flat, fanning trendlines, etc. etc.
Before looking at the other names, a couple of notes: one, I am not a chartist, nor would I trade any more without charts. You may find some of my trendline drawing a little odd; I believe charts are messy and full of the error common to most endeavors of human folly, cataloguing the market version of which is this blog’s reason for being. So I draw them where they make sense to me; you should not take them as technical guidelines, “training”, or anything else.
Similarly, I will describe some possible setups here, but following them blindly would be very silly on your part. You are not in my head, you do not read charts or broader movements as I do, and of course you do not trade what I trade. I’m describing one way of seeing these charts. I do not even say these are trades I will take myself; I’m just interested in what looks like some very good low-risk/solid-return setups. My goal is to improve my perception; I hope you have a similar goal. Otherwise, you risk frustration should a trade backfire for reasons you have not anticipated.
And finally, these are not home-run shorts I’m looking for. Too much uncertainty, too much influence from the news and the spin, and too many jumpy buyers just make shorting and holding for indefinite targets seem too risky to me. Small gains on low risk and relatively short holding periods (under 8 days) is my current strategy.
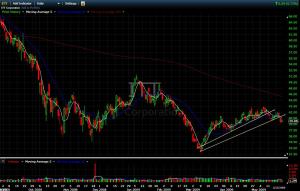 $ITT is, according to CAPS, “A multi-industry company engaged directly and through its subsidiaries in the design and manufacture of a range of engineered products and the provision of related services.” It did not actually rally as hard as my other picks, and it is headed into a zone of late-2008 congestion, but I like its lower high pre-break after reconfirming its 2009 earnings outlook, and would be surprised to see it clear that high again.
Entry on failed retest of trendline (~41.20) or, shorter-term/higher risk, failure to move above 5-day SMA (~40.50) T1 38.00 T2 37.00 T3 …
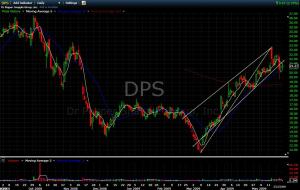 Ah, $DPS. Who doesn’t need a nice refreshing beverage in the summer? Me. And, it would appear, what is left of the rally. Steep rise here, clean break and lower high. Though you could also make the case, I suppose, that it failed its breakout (note the strangeness of my trendline) and is merely falling back into an April consolidation zone. (If you’re like me, you don’t really believe anything consolidated in April, being as it was so much ether and shortness of breath, but I digress.) I like the weak-volume failed breakout and the higher selling volume, I like the sharp moves down off the recent highs as reflected in 5-day SMA action, I just plain like it.
Entry on failed retest around 22. T1 20-20.25 T2 200-day SMA T3 ~18.70 T4 17.30ish
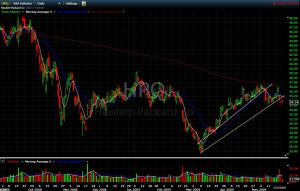 $HPQ is to me the trickiest of the four, mainly because the Q’s look much less decisively weak than the S&P (after earlier weakening). I see all kinds of great technical reasons here–it has now broken two trendlines, has a nice double-top/failure at 200-day, down in the lower end of its congestion zone–and last week’s earnings and guidance were pretty grim–but if the Q’s caught fire I would dump this quickly. It’s that “name you can trust” problem. Investors love it when you lay off a bunch of people!
Entry around where trendline and 5-day meet, ~35 (as always, after a high is in, not on the way up). T1 33.50 T2 32.80 T3 30.00
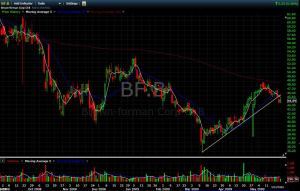 Booze is a cliche rally favorite, and $BF.B (or $BF-B or $BF/B or whatever depending on your broker) is looking mighty tired. I find this the prettiest chart–note the blow-off top, the slow decline into longer-term trend break, the angle of the 5-day (under the 20-day, under the 200) , etc. etc. Link
But it also has the trickiest entry, as it has yet to put in a lower high over multiple days, and looks to be in a downward channel already. You might enter anywhere between Friday’s close and 46 or so. Careful! T1 ~44.40 T2 43.40 T3 …
Should I enter or exit these positions, it will be noted, approximately in real time, on twitter. I still anticipate very light trading on my part, so we shall see.
All charts marked up on FreeStockCharts. If you need a free charting resource, get over there and get plotting.
Good luck out there.
